Have you ever wondered how to determine if there are significant differences between groups in your data? Today, we’ll explore Analysis of Variance (ANOVA) and understand when to apply it, using the well-known Iris dataset.
First, I’ll walk you through what ANOVA is, then move on to One-Way ANOVA and explain when to use it. Later, I’ll show you how to apply it using a practical example with the Iris dataset. If you’re interested in trying this out, feel free to download the dataset from my GitHub, which I’ll link at the end.
What is Anova?
Analysis of Variance (ANOVA) is a statistical method used to determine whether there are significant differences between the means of three or more independent groups. By comparing variances within groups to the variance between groups, ANOVA helps assess whether any observed differences are likely due to chance or represent a true effect.
Types of Anova:
One-Way ANOVA: Used when you have 1 categorical variable with 3 or more groups and 1 numerical dependent variable.
Two-Way ANOVA: Used when you have 2 categorical variables (each with 2 or more groups) and 1 numerical dependent variable.
In this post I will taking about one-way Anova not two-way Anova
Hypothesis in Anova
Null Hypothesis (H0): This hypothesis states that there are no differences among the group means. In other words, any observed differences are due to random sampling variability. Mathematically, it can be represented as:
H0:μ1=μ2=μ3…………=μk
where μ represents the group means, and k is the number of groups.
Alternative Hypothesis (H1): This hypothesis posits that at least one group mean is different from the others. It does not specify which groups are different; it merely indicates that a difference exists. This can be expressed as:
H1:At least one μi is different from the others
Understanding the Steps of Anova Using Iris Dataset
Step 1:
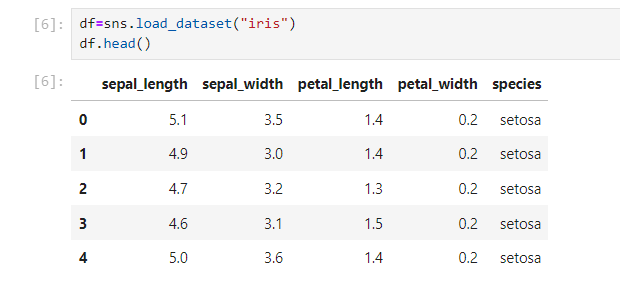
So, first, you need to load the dataset using pandas library.
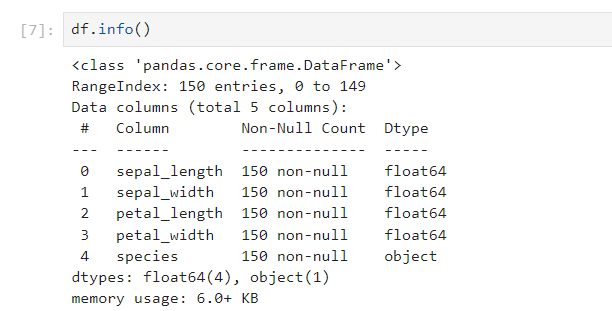
Next, you need to understand the data. In Python, we can use .info() or .describe() get an overview of the dataset. This will help you identify the columns you’re interested in and their data types.
Step 2:
Based on the question, you will determine which statistical test to use. For instance, in this case, I am using the Iris dataset to compare species(categorical) with sepal_width(numerical).
Now, I know that there are two tests I can perform for this scenario: an independent t-test or One-way ANOVA.
So, how do I decide which one to use?
To make that decision, I need to find out how many groups are in the species column. If there are 2 groups, then I will use an independent t-test. If there are more than 2 groups, I will proceed with ANOVA.
Step 3:
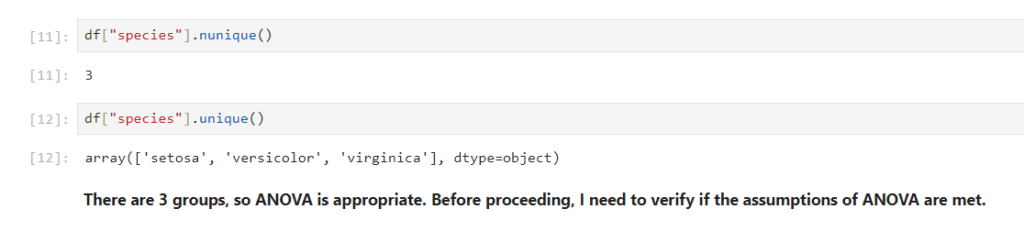
Here, in this case we have 3 groups, so I can use ANOVA. However, before running the ANOVA, we need to confirm that it satisfies the assumptions of anova, because One-way ANOVA assumes that data follows normal distribution and have equal variances across groups.
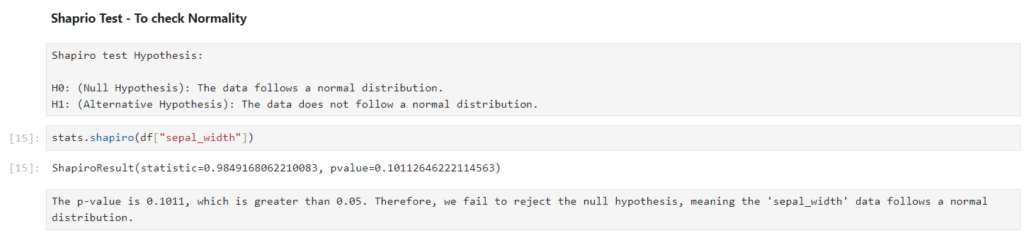
- Normality: I will perform a Shapiro-Wilk test for each group to check if the fare data follows a normal distribution.
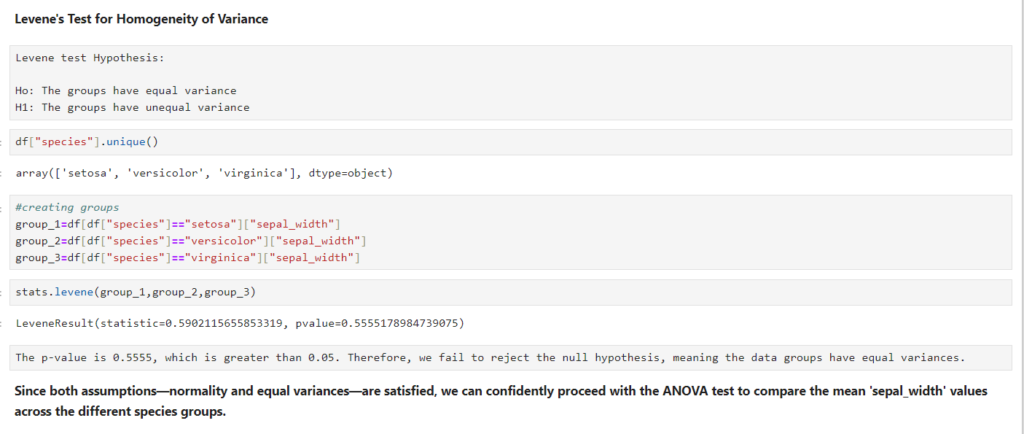
- Equal Variance: Next, I will use Levene’s test to check for homogeneity of variances across the groups.
If both assumptions are satisfied, I can proceed with the one-way ANOVA. If normality fails, I may consider using the Kruskal-Wallis test, which is a non-parametric alternative. If equal variances fail, I can opt for Welch’s ANOVA.
Here we can see that it satisfies both the cases so lets do Anova test.
Step 4:
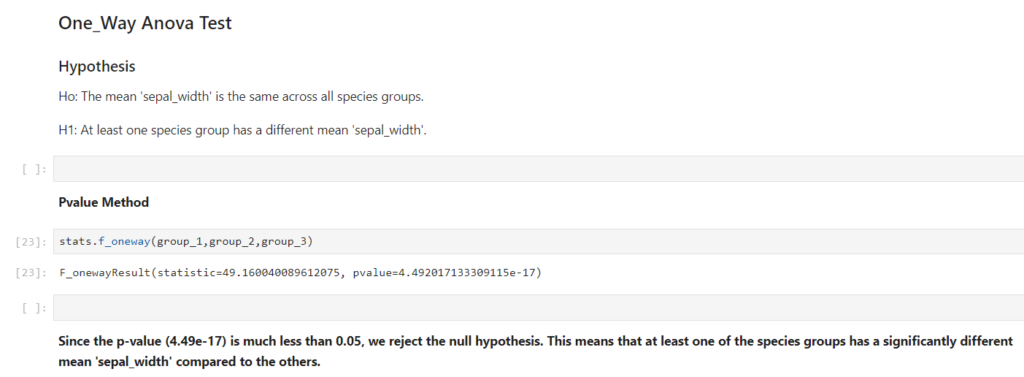
Once I run the ANOVA, I will look at the F-statistic and the p-value to interpret the results.
- If the p-value is less than 0.05, it indicates a significant difference in average sepal_width between at least one pair of species.
- If the p-value is greater than or equal to 0.05, I conclude that there is no significant difference in average sepal_width across the species.
Step 4b (optional):
We can also use the critical value approach which is comparing the F-statistic to a threshold. Both methods are valid, but using the p-value is more common and simpler.
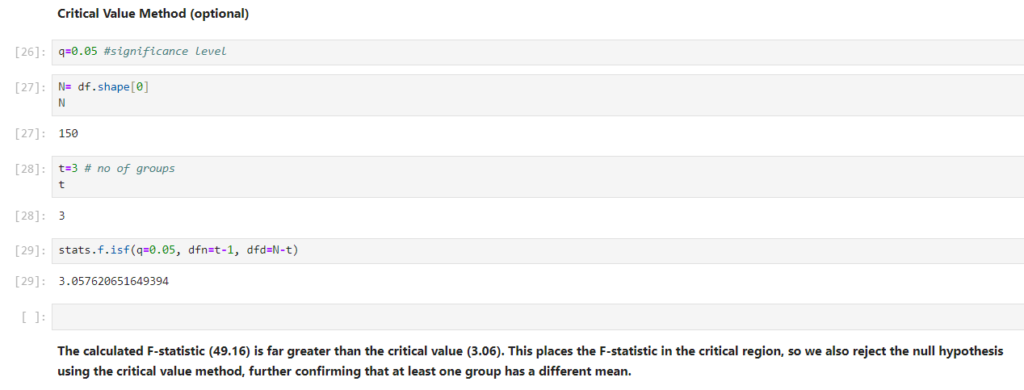
Note: The critical value approach is valid but optional. If you want to use it, make sure you’re aware of the degrees of freedom (dfn = t – 1 for between groups, and dfd = N – t for within groups).
Step 5:
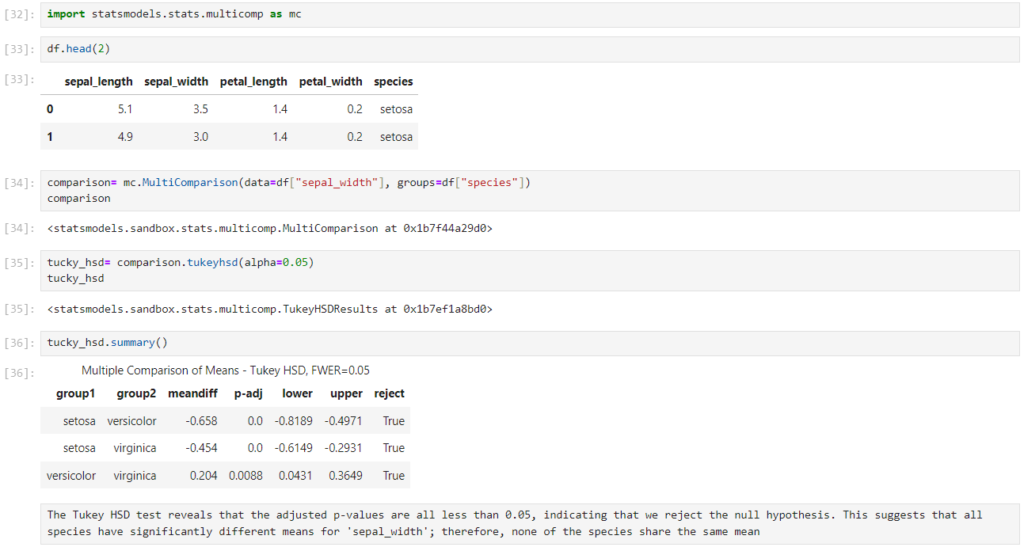
If the ANOVA indicates significant differences, I will perform a post-hoc test, such as Tukey’s HSD, to find out which specific groups differ. The output will include a table showing pairwise comparisons and their significance levels.
Now I hope you’re getting a good grasp on how to use One-Way ANOVA. We’ll also explore scenarios when normality fails, so stay tuned for that. If you’re looking for the Jupyter Python file example I shared to explain the concepts above, you can access the Iris dataset one-way ANOVA
Tip: Did you know there are several types of ANOVA other than One-Way ANOVA?
Here are some other types you might find interesting: Two-Way ANOVA, Three-Way ANOVA, Multivariate ANOVA (MANOVA), Repeated Measures ANOVA, Mixed-Design ANOVA (Split-Plot ANOVA (SPANOVA), ANCOVA (Analysis of Covariance)
